
Today I will take a look at my full set of sales since February. I have been tracking my sales in an Excel sheet along a variety of dimensions and I’ve already done one analysis, but it’s time for another one.
What have I been doing
Before we dive into the data, I want to talk a little bit about what my current approach to goldmaking is.
Right now I have bank alts on 9 EU realms where I am active. I mostly focus on the BoE flipping market. I also do a little bit of battle pets and material flipping, mostly to raise capital so I can get into BoEs. On two of my realms I also sell assorted crafted goods, but I don’t craft any new stuff, I just post what I have previously crafted.
My main routine is to log in three times a week to do a full loop through all my realms. I will collect all my expired auctions and sales and og repost them to the AH. I try to run shopping scans for BoEs at least twice a week as well to keep my inventory going.
The results
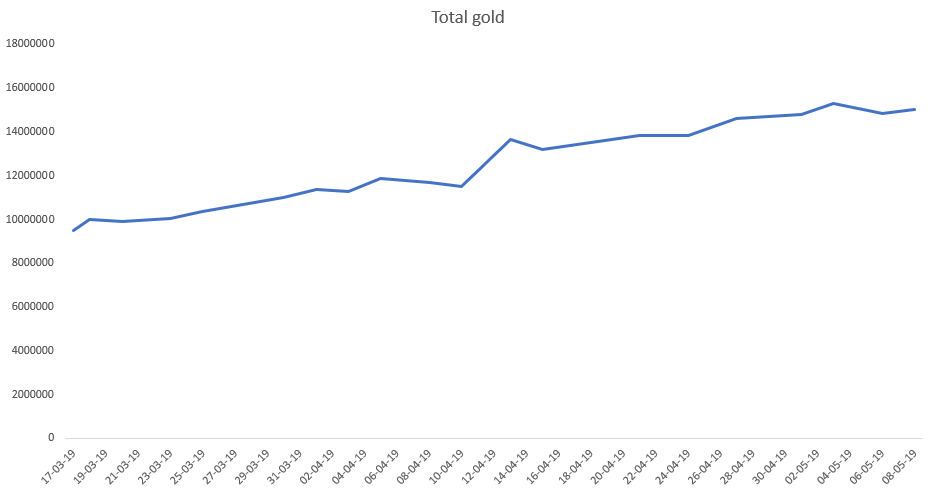
We will pick up where I left off the last time, which was in March. Back then I had about 9.5 million gold in total. As of right now I’m sitting at 13.6 million gold and I have bought tokens for 1.4 million gold. The graph below shows my total gold, including the gold I spent on tokens.
Total sales
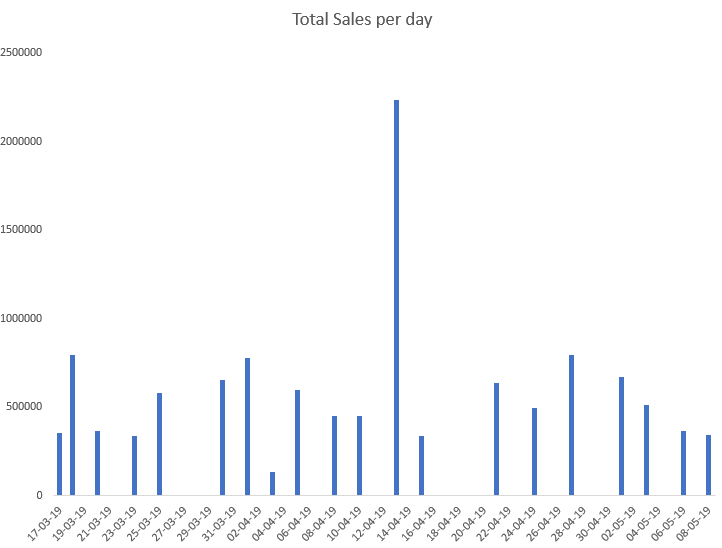
My total sales over this period were 11.8 million gold. This is from the 17th of March until today. The bar graph below shows my sales on a per day basis for the period. We can see that there is one pretty huge outlier where I hit 2.2 million gold in sales on a single day across all my realms. Outside of that my mailbox sizes are fairly even. They hover in the 300-900k range with an average of about 600k gold in sales per day. The standard deviation is about 380k though so variation is huge, but that’s expected with BoEs.
Average mailbox size
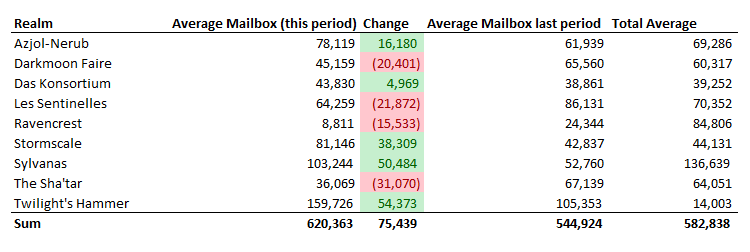
My average sales per realm are shown below. As you can see my sales for this period are slightly higher than they were in the period I analyzed back in March. Obviously some of my realms have been doing worse though. Sylvanas is probably influenced quite heavily by 1 single sale as I sold a BoE for 760k on that realm, which will skew the data by itself. Overall it looks like things are going in the right direction though.
The BoE market
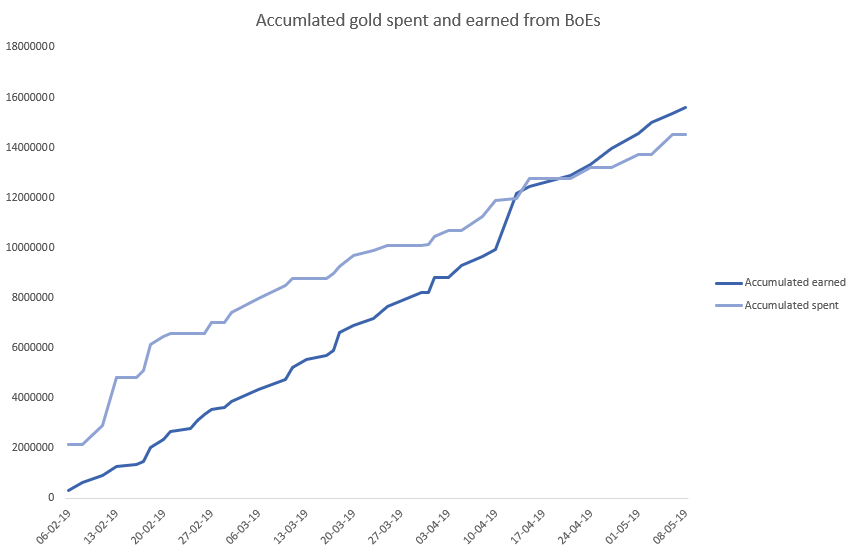
The BoE market has finally hit break even! I have spent a massive 14.5 million gold on BoEs. Luckily my BoE sales have now passed 15.6 million gold so I have made a net profit of 1.1 million. This doesn’t even include all the BoEs I have on my bankers either! The graph below shows that I broke even around the 20th of April after the massive 2.2 million gold mailbox. The gap has been very slowly widening in the right direction since then!
Summary
It looks like everything is working out great right now! Gold is flowing in, and BoEs are profitable. My profit over this period was a cool 5.4 million gold! I’d say that’s pretty good for someone who only plays three times a week!